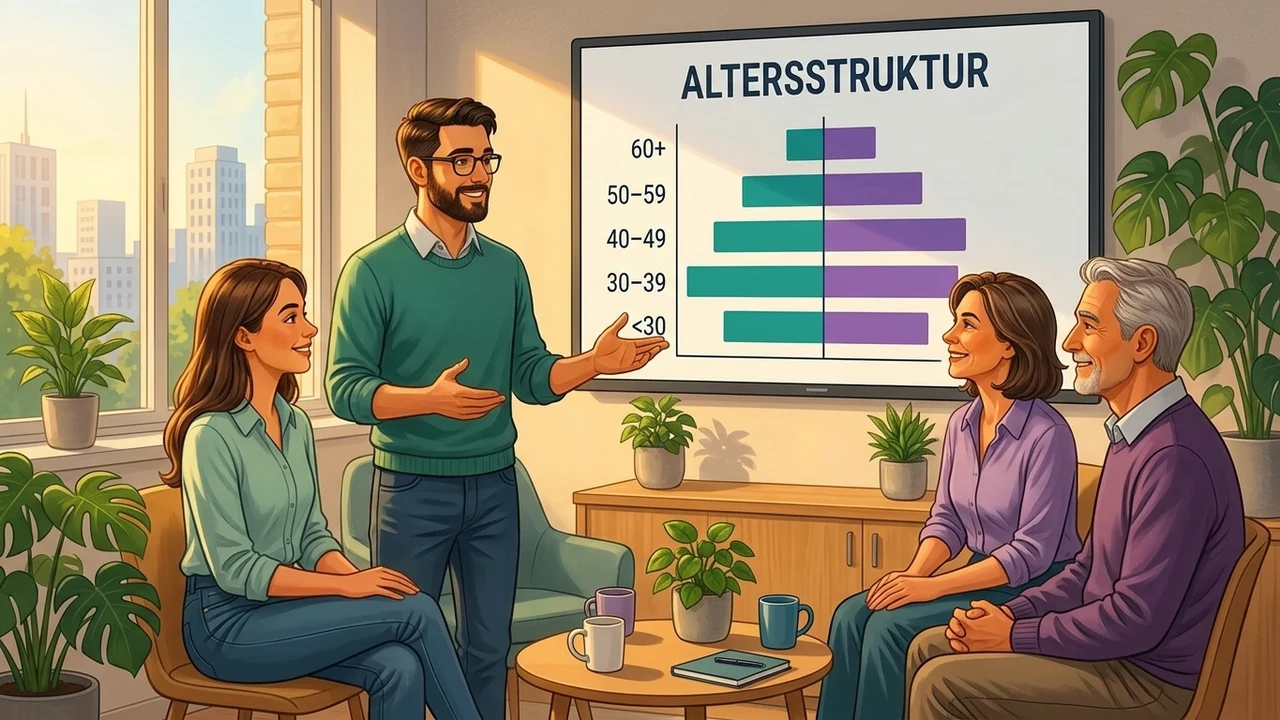
Analyzing Age Structure
Why does age structure belong in every BGM report — and how do I analyze it correctly?
Note: refers to German law. Age structure is BGM's early-warning indicator, revealing health and talent risks years before absences rise. Analyze via standard groups (<30, 30–39, 40–49, 50–59, 60+) — average age alone hides the distribution.
Standard Age Groups and Their BGM Significance
| Group | Age | BGM Perspective |
|---|---|---|
| < 30 | up to 29 | Career entry; prevention has the longest effect; retention and expectation topics (health benefits as employer attractiveness) |
| 30 – 39 | 30 – 39 | Rush hour of life: work-life balance, mental strain; often unremarkable absence rates despite real strain |
| 40 – 49 | 40 – 49 | Transition decade: first chronic complaints; last good point for structural/environmental prevention measures |
| 50 – 59 | 50 – 59 | Rising health risk, longer case durations; core target group for ergonomics, work ability, age-appropriate work design |
| 60 + | from 60 | Pre-retirement cohorts: knowledge transfer, exit planning, flexible transitions; absences here hit key knowledge |
Average Age Is Blind — the Distribution Is What Counts
Two workforces with an average age of 43 can look completely different: an even distribution across all age groups — or two peaks made up of many people in their mid-twenties and many in their late fifties, with a thin middle. For BGM these are two different worlds: the first ages predictably, the second loses a large share of its experienced staff within a few years while simultaneously needing to retain a young cohort.
That's why age structure is evaluated as a distribution across standard groups — headcount and share per group, supplemented by average age as a trend metric. Proven formats: bar chart or age pyramid (mirrored by gender), reviewed once a year on a fixed reporting date.
The real value emerges in the outlook: projecting the same analysis five and ten years forward (each group moves up, exits from statutory retirement age drop out) shows what the workforce will look like if today's measures are meant to take effect. This simple projection is the most compelling demographic case for any leadership team.
Age Structure and Absences: Sick Less Often, But Longer
The link between age and absences is often oversimplified. The recurring pattern in health insurers' health reports: younger employees are sick more often but briefly; older employees less often but for markedly longer per case. The raw case count for a young workforce can be higher, while absence days for an older workforce dominate.
For reporting, that means breaking down sick-leave rate and sick days by age group (respecting the minimum group size — see the data protection section) and combining this with duration-group analysis. An aging workforce predictably shifts the distribution toward long-term cases — anyone who sees this coming in a five-year outlook can act early with prevention, ergonomics, and BEM processes instead of managing symptoms later.
Important for fair interpretation: rising absences in an aging workforce are partly a structural effect, not program failure. Anyone comparing BGM success over the years should name the age effect — otherwise every demographically driven shift gets wrongly blamed on BGM.
Demographic Change: Why the Analysis Matters Now
The German baby-boom cohorts will reach retirement age by the mid-2030s — in many companies, the 55+ group already makes up a quarter to a third of the workforce today. Every avoidable early exit for health reasons worsens an already tight talent situation.
BGM has a double effect here: it extends older employees' work ability (ergonomics, prevention of chronic conditions, tailored job design) and increases employer attractiveness for younger employees, who increasingly expect health benefits as standard. Age structure analysis provides the factual basis to calibrate both directions correctly.
The Work Ability Index (WAI) has become the established tool at the individual level — a validated short questionnaire on work ability, especially informative in older workforces. It isn't part of the basic metrics set, but it's the natural next step once the structural analysis shows a need for action.
From Analysis to Action: Age-Appropriate, Not Age-Fixated
Age structure analysis shouldn't lead to 'back school for older employees.' Modern demographic work is age-appropriate: it designs work so employees stay healthy across all life phases — instead of patching deficits in one age group.
Typical actions by finding: Thin group under 30 → make health benefits visible in recruiting and onboarding, prioritize retention topics. Strong 50–59 group → ergonomics initiative, risk assessment with an age focus, professionalize BEM processes, launch knowledge-transfer tandems. Two-peaked distribution → cross-generational formats so health culture doesn't fragment into age cohorts.
The GKV (German statutory health insurance) focus areas cover all of these directions — from exercise and ergonomics to mental health to health-conscious leadership. For funding eligibility under § 20b SGB V, measures must be derived from an analysis: this is exactly the bridge that age structure analysis provides.
Data Protection: Date of Birth In, Groups Out
Date of birth is a standard HR data field — age structure analysis is far less sensitive under data protection law than absence analyses. Even so, the aggregation rules apply: groups are evaluated, never individuals with age shown in the report.
The minimum group size of five applies as soon as age groups are cross-tabulated with other dimensions: 'age group 60+ in department Y' can identify a specific person in small units — especially combined with absence or gender breakdowns. Cells under five are suppressed or reported at a coarser level.
Combined analyses of age and health data (absences by age group) fall under the stricter rules for health data under Art. 9 DSGVO — the full aggregation requirement from the basic metrics set applies here.
Related measures & topics
Key takeaways
- Average age hides the distribution — always evaluate in standard groups (<30 to 60+).
- Pattern from health insurers' reports: younger employees sick more often but briefly; older employees less often but longer per case.
- The 5-/10-year projection of age structure is the most compelling demographic case for leadership.
- Name the age effect fairly: in an aging workforce, rising absences are partly a structural effect, not BGM failure.
- Derive measures that are age-appropriate, not age-fixated — from onboarding health to knowledge-transfer tandems.
- Minimum group size of 5 for every cross-tabulation (age × department × gender); combined age-absence data falls under Art. 9 DSGVO.
Frequently asked questions
Which age groups are standard for BGM reporting?+
Proven and compatible with common reports: <30, 30–39, 40–49, 50–59, 60+. What matters less is the exact cutoff than consistency: define it once, evaluate the same way every year — only then do shifts over time become visible.
Is age structure analysis compliant with the DSGVO (Germany's GDPR)?+
Yes — date of birth is a standard HR data field, and aggregated group analysis is uncritical. Caution with cross-tabulations: age group × department × gender can identify individuals in small units. Maintain a minimum group size of 5; combined age-absence analyses fall under Art. 9 DSGVO.
What is the Work Ability Index (WAI)?+
A scientifically validated short questionnaire for self-assessing work ability, developed in Finnish occupational research. It measures how well employees rate their current and future work ability relative to job demands. Useful as a deeper dive after the structural analysis, especially in workforces with a strong 50+ share.
At what company size does age structure analysis pay off?+
From around 20 employees, the group distribution yields reliable insights; below that, the qualitative view leadership already has is sufficient. The five- and ten-year projection, by contrast, pays off at any size — small companies in particular are hit hard when a single experienced employee leaves.
How often should age structure be evaluated?+
Once a year on a fixed reporting date (e.g., Dec 31) is enough — the structure changes slowly. More important than frequency is the triad: current distribution, year-over-year comparison, five- to ten-year projection. Add ad hoc reviews for major restructurings, acquisitions, or site changes.
Age Structure Automatically From Master Data
EasyBGM calculates age distribution and average age directly from your HR data — including benchmark comparisons and no spreadsheet upkeep.
Sources
- TK Gesundheitsreport 2025 — Absences by Age and Diagnosis ↗
- GKV Prevention Guide 2025 — Focus Areas and Analysis Requirements (§ 20b SGB V) ↗
- Art. 9 DSGVO — Processing of Special Categories of Personal Data ↗
Last updated: 2026-07-07. Not legal or tax advice — have your specific case reviewed by a professional.